Cost Reports
This report provides the cost details at project level along with the services details.
Below is an example to illustrate the generation of reports.
-
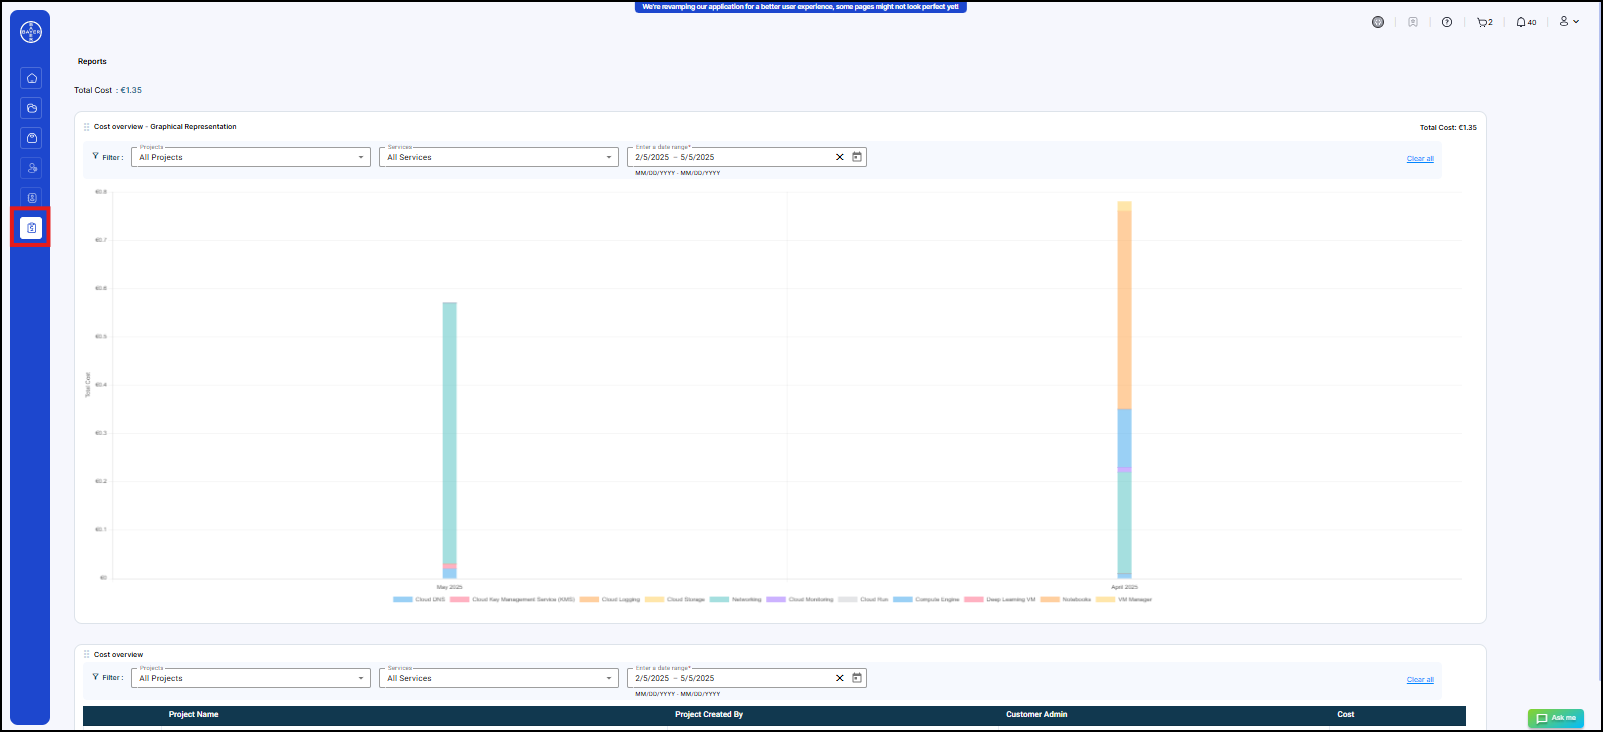
Click on "Cost Report" on the left panel.
-
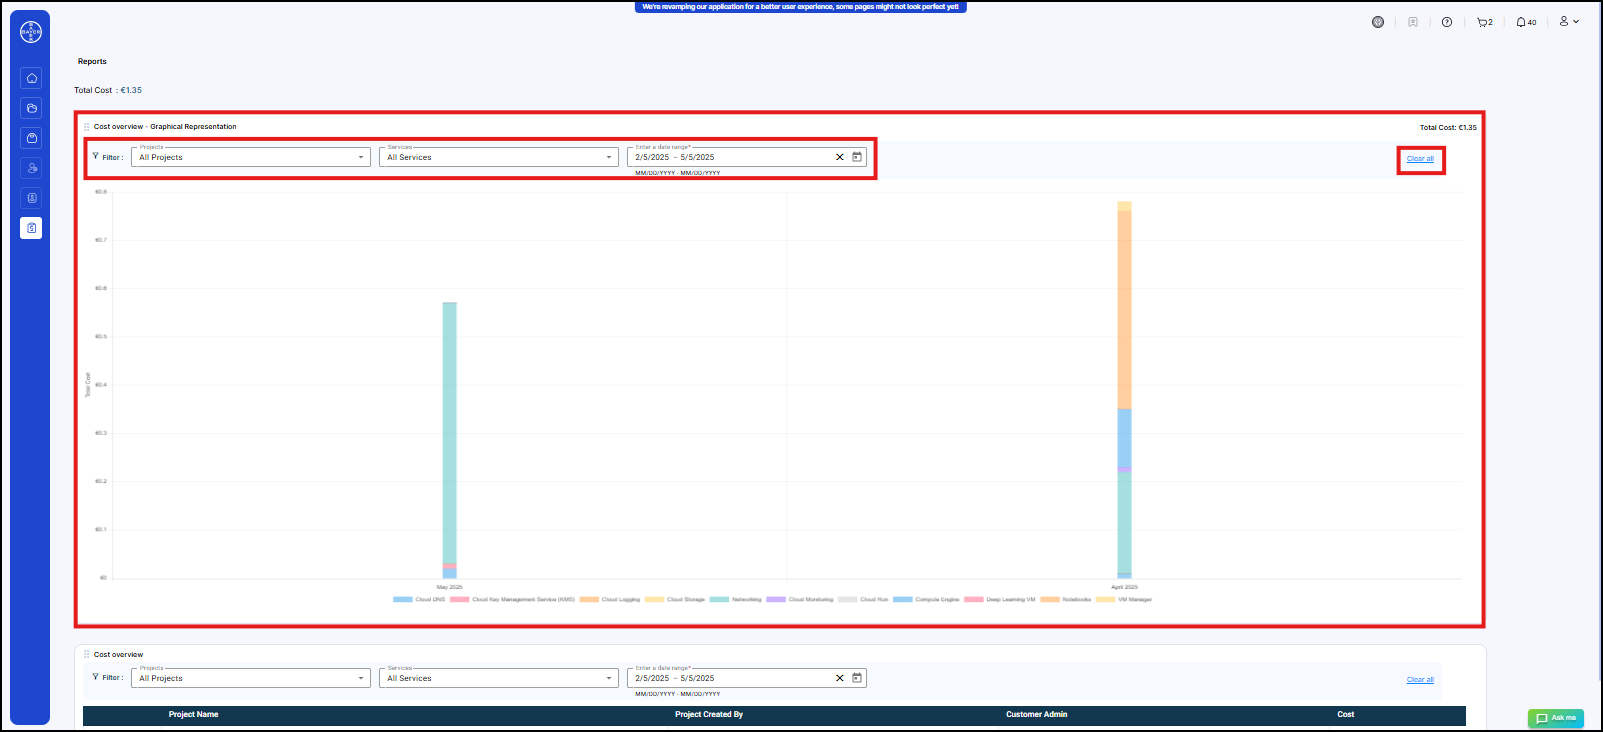
This graph represents the entire cost of the organization. Each different coloured bar represents the different services and their associated cost. The admins can use the filter option to get the cost for the required project, service or for any particular date range (using the calendar icon). In case the filters were entered incorrectly, they can simply "Clear all".
-
On scrolling down, the admin can see the tabular version of the cost graph.
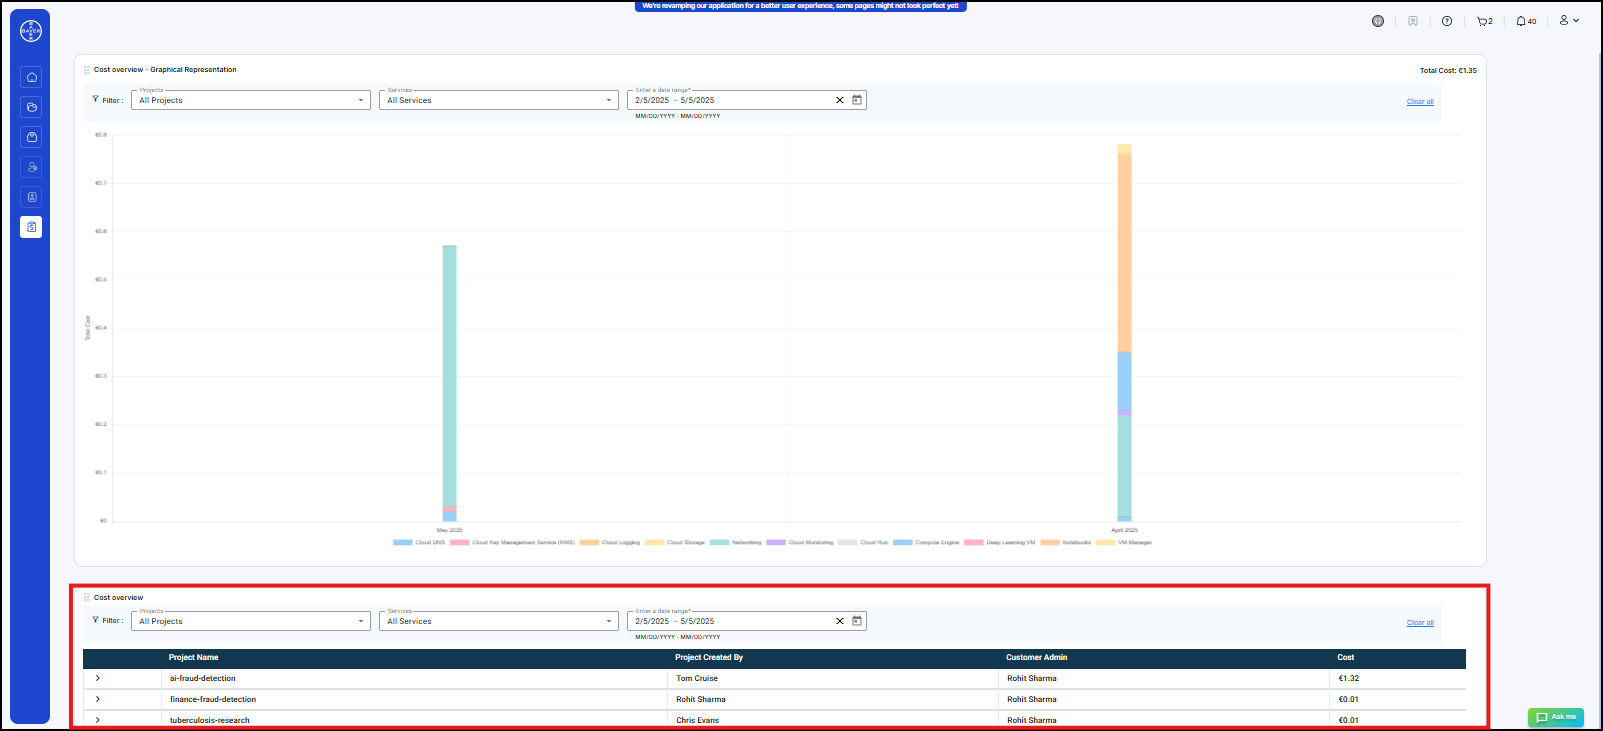
Here, the admin can see the different projects that are part of the organization and the associated cost with it. -
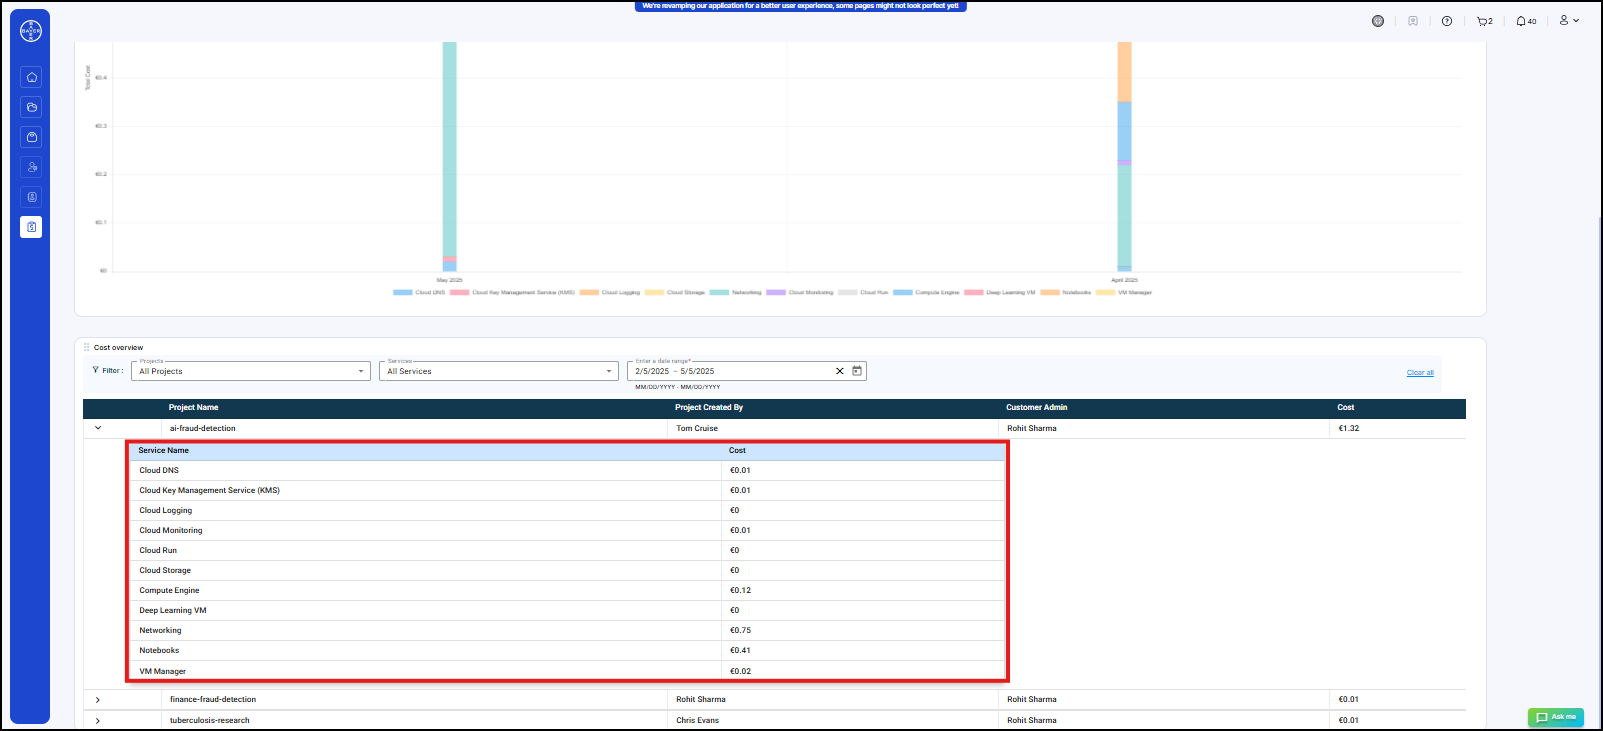
On clicking the dropdown of the project, the cost of the services belonging to a particular project will be displayed.
The following KPIs are implemented:
| KPI | Description |
|---|---|
| Cost computation per project | Calculates the total cost associated with each project, helping admins track and manage project expenses effectively. |
| Cost computation per services | Evaluates the cost of various services used within the platform, enabling admins to analyze spending and optimize service-related expenses. |